Multiple Choice
The following graph shows the average and marginal revenue curves for a monopolist:
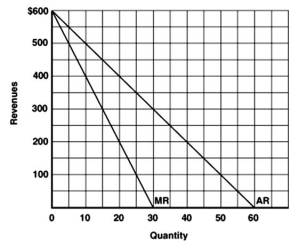
-Refer to the graph above to answer this question.At what price is total revenue maximized?
A) 0.
B) $30.
C) $300.
D) $600.
Correct Answer:

Verified
Correct Answer:
Verified
Related Questions
Q67: The following table gives the cost and
Q68: What is meant by barriers to entry?
Q69: The following table gives the cost and
Q70: Where is a monopolist's profit maximized?<br>A)Where marginal
Q71: "Since there is only one seller in
Q73: Larraine is the only jembe drum producer
Q74: All of the following except one are
Q75: All of the following,except one,are examples of
Q76: An unregulated monopolist could sell the first
Q77: Calculate consumer surplus based on the graph