Multiple Choice
The following graph depicts the costs and revenues for an unregulated monopolist:
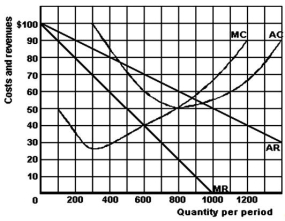
-Refer to the graph above to answer this question.What is the monopolist's maximum level of total profits?
A) $0.
B) $6,000.
C) $8,000.
D) $18,000.
E) $48,000.
Correct Answer:

Verified
Correct Answer:
Verified
Related Questions
Q1: A socially optimum price is a price
Q2: The following table shows the demand facing
Q3: When is a monopolist's total revenue at
Q5: <img src="https://d2lvgg3v3hfg70.cloudfront.net/TB5692/.jpg" alt=" -Refer to the
Q6: All of the following except one are
Q7: What are public utilities?<br>A)Goods or services provided
Q8: State five criticisms of a monopoly.
Q9: The following graph gives cost and revenue
Q10: All of the following except one are
Q11: The following graph gives cost and revenue