Multiple Choice
The following graph shows the market demand and average cost curve for electricity (in millions of kilowatts) in an urban centre:
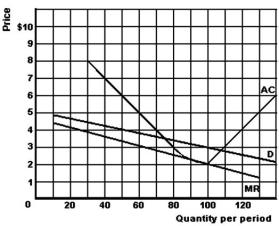
-Refer to the above graph to answer this question.Suppose that the price is $3,and the market is served by two competing firms,each with average costs as shown in the graph and each having 50% of the market.What will be the quantity produced by each firm?
A) 50.
B) 55.
C) 75.
D) 100.
E) 110.
Correct Answer:

Verified
Correct Answer:
Verified
Q37: The following data refers to an unregulated
Q38: Which of the following statements is true
Q39: Which of the following is an example
Q40: Where is a monopolist's profit maximized?<br>A)At break-even
Q41: The figure below shows the demand for
Q43: The following table shows the demand facing
Q44: An unregulated monopolist could sell the first
Q45: The following graph gives cost and revenue
Q46: Describe why marginal revenue is always less
Q47: Under what circumstances will a profit-maximizing monopolist