Multiple Choice
The following graph shows the market demand and average cost curve for electricity (in millions of kilowatts) in an urban centre:
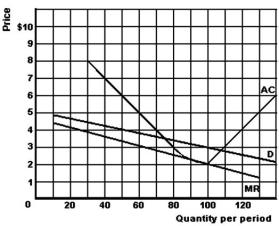
-Refer to the above graph to answer this question.Suppose that the price is $3,and the market is served by two competing firms,each having 50% of the market.What will be the profit or loss made by each firm?
A) $0.
B) Loss of $50.
C) Loss of $100.
D) Loss of $150.
E) Profit of $100.
Correct Answer:

Verified
Correct Answer:
Verified
Q114: You own four firms that produce different
Q115: The following graph gives cost and revenue
Q116: <img src="https://d2lvgg3v3hfg70.cloudfront.net/TB5692/.jpg" alt=" -Refer to the
Q117: State whether each of the following is
Q118: The following data relates to an unregulated
Q120: <img src="https://d2lvgg3v3hfg70.cloudfront.net/TB5692/.jpg" alt=" -Refer to the
Q121: Table 10.5,which is data for a monopolist.<br>
Q122: Suppose that a monopolist was selling 20
Q123: The following table gives the cost and
Q124: Based on the graph above,the monopoly firm