Multiple Choice
Figure 10.10 depicts the cost and revenue curves for a monopolist.
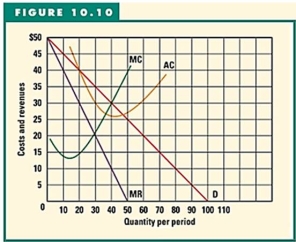
-Refer to Figure 10.10 to answer this question.What is the level of profits at the profit-maximizing output?
A) 0.
B) $20.
C) $150.
D) $450.
E) $600.
Correct Answer:

Verified
Correct Answer:
Verified
Q141: <img src="https://d2lvgg3v3hfg70.cloudfront.net/TB5692/.jpg" alt=" -Refer to the
Q142: The following data relates to an unregulated
Q143: If price were set equal to MC,as
Q144: Distinguish between the marginal revenue for a
Q145: All of the following,except one,are ways that
Q147: All of the following,except one,are true at
Q148: <img src="https://d2lvgg3v3hfg70.cloudfront.net/TB5692/.jpg" alt=" -Refer to the
Q149: A fair-return price is a price set
Q150: The following table gives the cost and
Q151: All of the following statements,except one,are true