Multiple Choice
In the graph below six short-run average cost curves labeled a through f are illustrated.
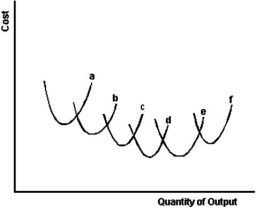
-Refer to the graph above to answer this question.Which set of short-run average cost curves illustrates economies of scale?
A) a and b only
B) a,b and c only
C) a,b,c,and d
D) d and e only
E) e and f only.
Correct Answer:

Verified
Correct Answer:
Verified
Q9: Are diminishing marginal productivity and diseconomies of
Q100: If a firm builds a larger plant
Q101: What is meant by the term "economic
Q102: All of the following,except one,are possible explanations
Q104: Below is short-run cost data for four
Q106: Below is short-run cost data for four
Q107: Economies of scale is the situation in
Q108: Which of the following is correct in
Q109: <img src="https://d2lvgg3v3hfg70.cloudfront.net/TB5692/.jpg" alt=" -Refer to Table
Q110: "The SRAC and LRAC curves are both