Multiple Choice
The graph below illustrates three demand curves.
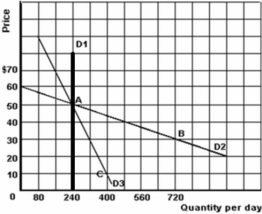
-Refer to the graph above to answer this question.Which of the following statements is correct?
A) The price elasticity of demand between points A and C on D3 is 0.267.
B) The price elasticity of demand between points A and C on D3 is 0.375.
C) The demand between points A and C on D3 is elastic.
D) The slope of demand curve D1 and its price elasticity are the same.
Correct Answer:

Verified
Correct Answer:
Verified
Q158: How can income elasticity be used to
Q159: What is the formula used to calculate
Q160: Which of the following statements is true
Q161: Which of the following products has the
Q162: Suppose that a 10% increase in the
Q164: If the government increases the excise tax
Q165: Below is some information on the demand
Q166: Define cross-price elasticity.What does it mean if
Q167: If cross-elasticity of demand is positive,we could
Q168: What is the effect of the imposition