Multiple Choice
The graph below illustrates three demand curves.
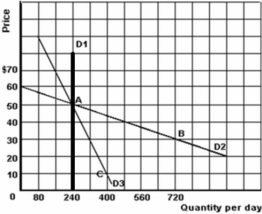
-Refer to the graph above to answer this question.Between the price range of $50 and $60,which of the three demand curves is the most elastic?
A) D1.
B) D2.
C) D3.
D) Cannot be determined.
Correct Answer:

Verified
Correct Answer:
Verified
Q72: Why might a good harvest be bad
Q73: <img src="https://d2lvgg3v3hfg70.cloudfront.net/TB5692/.jpg" alt=" -Refer to the
Q74: <img src="https://d2lvgg3v3hfg70.cloudfront.net/TB5692/.jpg" alt=" -Refer to the
Q75: What measures the responsiveness of quantity demanded
Q76: Below is some information on the demand
Q78: Which of the two following pairs of
Q79: Below is some information on the demand
Q80: Suppose the demand curve is perfectly inelastic
Q81: Below are some data on price,income and
Q82: Define 'elasticity of supply'.How is it calculated?