Multiple Choice
Below is a graphical representation of the wheat market in the distant land of Nod.
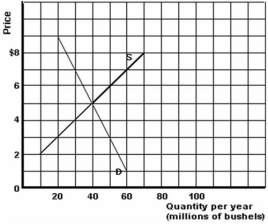
-Refer to the graph above to answer this question.What is the price elasticity of demand between the original equilibrium and the new equilibrium after the increase in supply of 30 million bushels?
A) 0.44.
B) 0.5.
C) 2.
D) 2.25.
Correct Answer:

Verified
Correct Answer:
Verified
Q176: The list below refers to the price
Q177: <img src="https://d2lvgg3v3hfg70.cloudfront.net/TB5692/.jpg" alt=" -Refer to the
Q178: A firm's total revenue is equal to
Q179: According to reports,the supply of rose hip
Q180: Under which of the following situations will
Q182: <img src="https://d2lvgg3v3hfg70.cloudfront.net/TB5692/.jpg" alt=" -Refer to the
Q183: Suppose the demand curve is perfectly inelastic.How
Q184: If demand is elastic and price rises,then
Q185: If demand is inelastic and price falls,then
Q186: What is true about the price elasticity