Multiple Choice
The graph below shows the supply and demand for tickets to a Raptors basketball game.
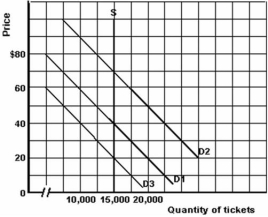
-Refer to the graph above to answer this question.All of the statements below,except one are correct.Which is the exception?
A) If the price of a ticket is $40 and demand is D3,then there will be 5,000 unsold tickets.
B) If the price of a ticket is $60 and demand is D2,then there is a shortage of 2,500 seats.
C) If the price of a ticket is $20 and demand is D1,then 5,000 people who would like to attend the game will not be able to unless they are able to buy a ticket from a scalper.
D) Any price under $40 will result in all the tickets being sold regardless of which of the three demand curves is considered.
Correct Answer:

Verified
Correct Answer:
Verified
Q104: What is the most likely effect of
Q105: What will cause the price elasticity of
Q106: Supply elasticity is measured by percentage change
Q107: <img src="https://d2lvgg3v3hfg70.cloudfront.net/TB5692/.jpg" alt=" -Refer to the
Q108: Below are some data on price,income and
Q110: Answer the following questions with respect to
Q111: What is the effect of a rise
Q112: Table 4.3 shows the market demand for
Q113: Define the term income elasticity.What does it
Q114: Suppose the supply curve is perfectly inelastic