Multiple Choice
The graph below shows the supply and demand for tickets to a Raptors basketball game.
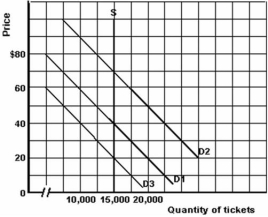
-Refer to the graph above to answer this question.Which of the following statements is correct regarding the change in the demand curve from D1 to D2?
A) Demand has decreased by 7,500.
B) Demand has increased by 7,500.
C) Demand has decreased by 20.
D) Demand has increased by 20.
E) None of the choices are correct.
Correct Answer:

Verified
Correct Answer:
Verified
Q185: If demand is inelastic and price falls,then
Q186: What is true about the price elasticity
Q187: Below are some data on price,income and
Q188: The Dean of Arts recently announced a
Q189: How is a firm's total revenue calculated?<br>A)Price
Q190: What is the term for the total
Q191: <img src="https://d2lvgg3v3hfg70.cloudfront.net/TB5692/.jpg" alt=" -A manufacturer of
Q192: Which of the following statements is most
Q193: The price elasticity of demand coefficient is,technically,always
Q195: What is the relationship between goods A