Multiple Choice
The product is a normal product.
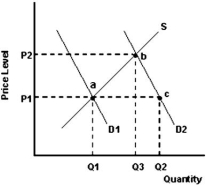
-Refer to the graph above to answer this question.What does the distance Q1 to Q2 represent?
A) An increase in the quantity demanded.
B) A surplus at price P1.
C) A shortage at price P1.
D) The result of a decrease in income.
Correct Answer:

Verified
Correct Answer:
Verified
Q73: What is the effect on product A
Q74: What is the equilibrium price?<br>A)The price at
Q75: <img src="https://d2lvgg3v3hfg70.cloudfront.net/TB5692/.jpg" alt=" -Refer to Figure
Q76: Which of the following pairs of products
Q77: What is the term for the mechanism
Q79: What is the term for income measured
Q80: <img src="https://d2lvgg3v3hfg70.cloudfront.net/TB5692/.jpg" alt=" -Refer to the
Q81: <img src="https://d2lvgg3v3hfg70.cloudfront.net/TB5692/.jpg" alt=" -Refer to the
Q82: If the price of gasoline goes up,then
Q83: The following table shows the initial weekly