Multiple Choice
The product is a normal product.
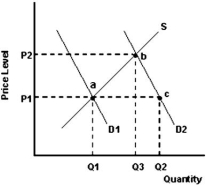
-Refer to the graph above to answer this question.What does the distance Q1 to Q3 represent?
A) The increase in equilibrium quantity traded resulting from an increase in demand.
B) The decrease in equilibrium quantity traded resulting from an increase in demand.
C) The increase in equilibrium quantity traded resulting from an increase in quantity demanded.
D) The increase in equilibrium quantity traded resulting from an increase in quantity supplied.
E) A shortage at price P2.
Correct Answer:

Verified
Correct Answer:
Verified
Q22: <img src="https://d2lvgg3v3hfg70.cloudfront.net/TB5692/.jpg" alt=" -Refer to the
Q23: What is supply?<br>A)The total quantity of goods
Q24: <img src="https://d2lvgg3v3hfg70.cloudfront.net/TB5692/.jpg" alt=" -Refer to the
Q25: <img src="https://d2lvgg3v3hfg70.cloudfront.net/TB5692/.jpg" alt=" -Refer to the
Q26: The following table shows the quantity demanded
Q28: What is the term for a table
Q29: Explain the effects of a decrease in
Q30: Assume that the market for jeans is
Q31: The product is a normal product.<br> <img
Q32: Briefly explain the six determinants of market