Multiple Choice
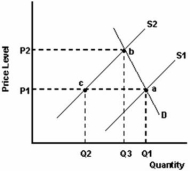
-Refer to the graph above to answer this question.What does the distance Q1 - Q2 represent?
A) A decrease in the quantity supplied.
B) A shortage at price P1.
C) A surplus at price P1.
D) The result of a decrease in the sales tax.
Correct Answer:

Verified
Correct Answer:
Verified
Q87: If the price of a product does
Q88: All of the following,except one,is demand.Which is
Q89: <img src="https://d2lvgg3v3hfg70.cloudfront.net/TB5692/.jpg" alt=" -Refer to the
Q90: <img src="https://d2lvgg3v3hfg70.cloudfront.net/TB5692/.jpg" alt=" The above information
Q91: <img src="https://d2lvgg3v3hfg70.cloudfront.net/TB5692/.jpg" alt=" The above information
Q93: What is supply?<br>A)The quantities which producers are
Q94: Table 2.11 depicts the market for mushrooms
Q95: Table 2.11 depicts the market for mushrooms
Q96: <img src="https://d2lvgg3v3hfg70.cloudfront.net/TB5692/.jpg" alt=" -Refer to the
Q97: Demonstrate graphically and explain verbally the concept