Multiple Choice
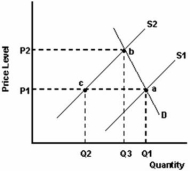
-Refer to the graph above to answer this question.What does the distance Q1 - Q3 represent?
A) The decrease in equilibrium quantity traded resulting from a decrease in demand.
B) The decrease in equilibrium quantity traded resulting from a decrease in supply.
C) The decrease in equilibrium quantity traded resulting from a decrease in the quantity supplied.
D) The decrease in equilibrium quantity traded resulting from an increase in the quantity supplied.
Correct Answer:

Verified
Correct Answer:
Verified
Q46: <img src="https://d2lvgg3v3hfg70.cloudfront.net/TB5692/.jpg" alt=" -Refer to the
Q47: The product is a normal product.<br> <img
Q48: The following table shows the initial weekly
Q49: In Agfa,at a market price of $3
Q50: <img src="https://d2lvgg3v3hfg70.cloudfront.net/TB5692/.jpg" alt=" -Refer to the
Q52: <img src="https://d2lvgg3v3hfg70.cloudfront.net/TB5692/.jpg" alt=" -Refer to the
Q53: <img src="https://d2lvgg3v3hfg70.cloudfront.net/TB5692/.jpg" alt=" The above information
Q54: The following figure shows the market for
Q55: Which of the following is explained by
Q56: <img src="https://d2lvgg3v3hfg70.cloudfront.net/TB5692/.jpg" alt=" Consider the demand