Multiple Choice

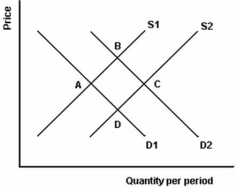
-Refer to the above graph to answer this question.How could you describe the movement from point A to point B?
A) An increase in demand which leads to a decrease in the equilibrium price and an increase in supply.
B) An increase in supply which leads to an increase in the equilibrium price and an increase in demand.
C) An increase in demand which leads to an increase in the equilibrium price and an increase in the quantity supplied.
D) An increase in supply which leads to an increase in the equilibrium price and an increase in the quantity demanded.
E) An increase in demand which leads to an increase in supply and an increase in the equilibrium price.
Correct Answer:

Verified
Correct Answer:
Verified
Q6: The following table shows the quantity demanded
Q7: <img src="https://d2lvgg3v3hfg70.cloudfront.net/TB5692/.jpg" alt=" -Refer to the
Q8: <img src="https://d2lvgg3v3hfg70.cloudfront.net/TB5692/.jpg" alt=" -Refer to the
Q9: Assuming apple juice is a normal good,which
Q10: <img src="https://d2lvgg3v3hfg70.cloudfront.net/TB5692/.jpg" alt=" -Refer to the
Q12: <img src="https://d2lvgg3v3hfg70.cloudfront.net/TB5692/.jpg" alt=" Consider the demand
Q13: In what way are Pepsi-Cola and Coca-Cola
Q14: Assume the market for apple pie is
Q15: What is the effect of producers' expecting
Q16: <img src="https://d2lvgg3v3hfg70.cloudfront.net/TB5692/.jpg" alt=" -Refer to the