Multiple Choice
The graph below is Mendork's production possibility curve for the only two goods that it produces-quirks and quarks.
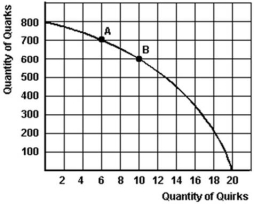
-Refer to the graph above to answer this question.If this society chooses to produce 10 quirks,what is the maximum quantity of quarks it can produce?
A) 500 quarks.
B) 800 quarks.
C) No quarks.
D) 600 quarks.
Correct Answer:

Verified
Correct Answer:
Verified
Q96: Figure 1.13 shows Mendork's production possibility curve
Q97: Below is a production possibilities curve for
Q98: All of the following,except one,are typically macroeconomic
Q99: Gwen had only $10 yesterday.She was uncertain
Q100: Which type of economy would involve a
Q102: Below is a production possibilities curve involving
Q103: Below is a list of resources.Indicate whether
Q104: Given the following production possibility curve.<br> <img
Q105: All of the following statements,except one,are normative
Q106: What are the names of the factor