Multiple Choice
The graph below is Mendork's production possibility curve for the only two goods that it produces-quirks and quarks.
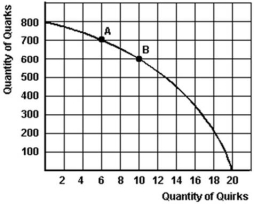
-Refer to the graph above to answer this question.If Mendork's current production is at point B,what is the opportunity cost of one more quark as output changes from point B to A?
A) 0.04 quirks.
B) 4 quirks.
C) 400 quirks.
D) 1 quirk.
E) 0.4 quirks.
Correct Answer:

Verified
Correct Answer:
Verified
Q65: _ efficiency refers to 'getting the most
Q66: What is the controversy with economic growth?<br>A)Economic
Q67: What is fundamental question is implied by
Q68: All of the following except one are
Q69: Using the table below,identify and explain the
Q71: All of the following except one are
Q72: Discuss the pros and cons of taking
Q73: Using the following information,<br> <img src="https://d2lvgg3v3hfg70.cloudfront.net/TB5692/.jpg" alt="Using
Q74: Meridith had only $16 to spend this
Q75: Refer to the table above to answer