Multiple Choice
The graph below is Mendork's production possibility curve for the only two goods that it produces-quirks and quarks.
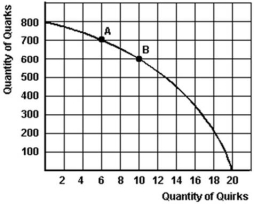
-Refer to the graph above to answer this question.If new technology increased the output of quirks by 50%,how many quirks could be produced if 600 quarks were produced?
A) 18 quirks.
B) 20 quirks.
C) 15 quirks.
D) 10 quirks.
E) No quirks.
Correct Answer:

Verified
Correct Answer:
Verified
Q22: Define economics.
Q23: The following table shows the production possibilities
Q24: Which of the following was argued by
Q25: Below is a production possibilities curve involving
Q26: Which of the following is true about
Q28: The graph below is Mendork's production possibility
Q29: What are the four basic ways that
Q30: Tigris produces only two products: tennis balls
Q31: Which of the following is correct?<br>A)Scarcity forces
Q32: All of the following except one are