Multiple Choice
Which graph most appropriately shows the density of water plotted against temperature? 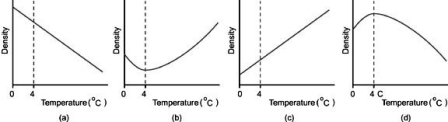
A) graph a
B) graph b
C) graph c
D) graph d
Correct Answer:

Verified
Correct Answer:
Verified
Related Questions
Q89: If you add heat energy to water
Q90: From the diagram above describing the phase
Q91: If the winds at the latitude of
Q92: If the specific heat of gold is
Q93: Why does transforming water from 100°C liquid
Q95: Water is most dense at _.<br>A)-4°C<br>B)0°C<br>C)+4°C<br>D)+100°C
Q96: Is the food compartment in a refrigerator
Q97: If you were somehow able to sit
Q98: Antarctica, which is mostly ice, is much
Q99: A material with a high specific heat