Multiple Choice
Which of the following energy diagrams best represents the changes in energy during addition of HBr to an alkene? 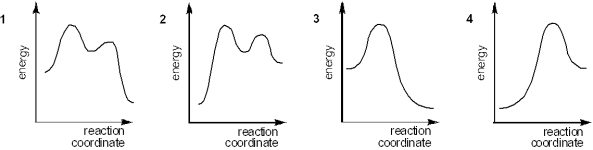
A) 1
B) 2
C) 3
D) 4
Correct Answer:

Verified
Correct Answer:
Verified
Related Questions
Q1: An acid with a low pK<sub>a</sub> is
Q2: Which of the following compounds is the
Q31: Which of the following is the strongest
Q45: Which of the following is the strongest
Q48: What is the value of the equilibrium
Q49: Which of the following has a
Q51: Which of the following is a definition
Q64: Which of the following is a feature
Q66: Which of the following concepts can be
Q84: Which of the following is the strongest