Multiple Choice
Which of the following diagrams represents the cardinality pairs in a situation where a specific production run results in a specific finished good,and a specific finished good is produced periodically?
A) 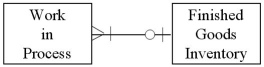
B) 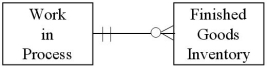
C) 
D) 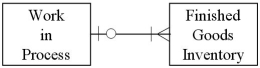
Correct Answer:

Verified
Correct Answer:
Verified
Related Questions
Q17: Which of the following is not one
Q18: Identify the entity that stores most of
Q19: Concerning the relationship from the Rent Item
Q20: Employees and Training entities is _ ,because
Q21: Which of the following diagrams represents the
Q23: Information about job roles is simply another
Q24: Employee number is most likely to be
Q25: Financial Institution number is most likely to
Q26: The temporal difference between Request Inventory and
Q27: Sales order number is most likely to