Essay
Statistics Canada gives the following mortality data for Canada in 2007. 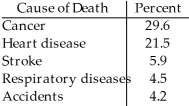
Create a bar chart for these data.
Correct Answer:

Verified
Correct Answer:
Verified
Related Questions
Q1: A college examined the impact of an
Q2: The City of Windsor Department of Parks
Q3: Students in a political science course were
Q5: A college examined the impact of an
Q7: A prediction of the number of medals
Q8: A survey of automobiles parked in student
Q9: Students in a political science course were
Q10: Statistics Canada gives the following mortality data
Q11: A survey of automobiles parked in student
Q53: Of the 1470 applicants to a college