Essay
The table compares what students at a Canadian college did after graduating in 1992,1998,and 2003. 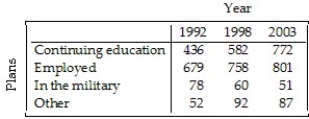
Create a segmented bar graph which shows the conditional distributions of plans for each of the three years.
Correct Answer:

Verified
Correct Answer:
Verified
Related Questions
Q28: A survey of automobiles parked in student
Q29: A company held a cholesterol screening clinic
Q30: Most patients who undergo surgery make routine
Q32: Statistics Canada gives the following mortality data
Q34: The focus of a recent survey was
Q35: The Centers for Disease Control in the
Q36: A survey of automobiles parked in student
Q37: A survey of automobiles parked in student
Q38: The table below compares what students at
Q57: Of the 1606 applicants to a college