Multiple Choice
The histogram shows the cost of living,in dollars,in 32 Canadian towns. 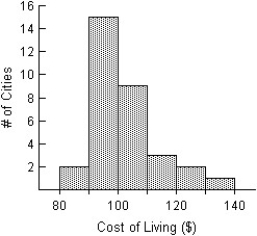
A) The distribution of the cost of living in the 32 Canadian cities is unimodal and skewed to the right.The distribution is centred around $100,and spread out,with values ranging from $80 to $139.99.
B) The distribution of the cost of living in the 32 Canadian cities is unimodal and skewed to the right.The distribution is centred around $110,and spread out,with values ranging from $80 to $140.
C) The distribution of the cost of living in the 32 Canadian cities is unimodal and skewed to the right.The distribution is centred around $90,and spread out,with values ranging from $80 to $139.99.
D) The distribution of the cost of living in the 32 Canadian cities is unimodal and skewed to the left.The distribution is centred around $100,and spread out,with values ranging from $80 to $139.99.
E) The distribution of the cost of living in the 32 Canadian cities is unimodal.The distribution is centred around $100,and spread out,with values ranging from $80 to $140.
Correct Answer:

Verified
Correct Answer:
Verified
Q4: During student-teacher negotiations at a certain high
Q16: A small company employs a supervisor at
Q58: In a college health course,65 students participated
Q59: Last year,nine employees of an electronics company
Q60: Here are the prices for 8 different
Q62: Here are the weights,in grams,of several snack
Q64: The local Tupperware dealers earned the following
Q65: The test scores of 15 students are
Q67: The test scores of 19 students are
Q68: In a survey,20 people were asked how