Multiple Choice
Shown below are the histogram and summary statistics for the reading scores of 29 fifth graders. 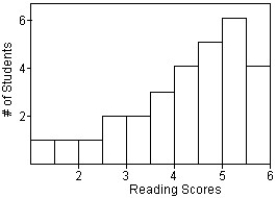

Which measures of centre and spread would you use for this distribution?
A) Mean and IQR,because the data is skewed to the left.
B) Median and standard deviation,because the data is skewed to the left.
C) Mean and standard deviation,because the data is skewed to the left.
D) Mean and standard deviation,because the data is symmetric.
E) Median and IQR,because the data is skewed to the left.
Correct Answer:

Verified
Correct Answer:
Verified
Q68: In a survey,20 people were asked how
Q69: The data below give the number of
Q70: The weights,in kilograms,of the members of the
Q71: Here are the commutes (in kilometres)for a
Q74: Here are the amounts,in dollars,spent by six
Q75: The histograms display the body fat percentages
Q77: Here are costs (in dollars)of 12 refrigerators.Find
Q78: In a survey,26 voters were asked their
Q104: Here are the number of baseball games
Q106: Ages of high school students.<br>A)The distribution would