Essay
Owners of a new computer store tracked sales (in thousands)for the first 12 days,and displayed the data in a scatterplot.Make a histogram of the daily sales since the shop has been in business. 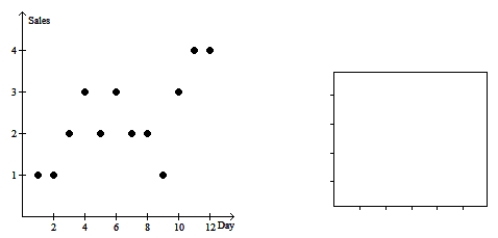
Correct Answer:

Verified
Correct Answer:
Verified
Q1: The paired data below consist of the
Q2: The paired data below consist of the
Q3: Determine whether the scatterplot shows little or
Q3: A science instructor assigns a group of
Q5: Student: grade point average,student: height (feet)<br>A)No direction,linear,moderate<br>B)No
Q6: Determine whether the scatterplot shows little or
Q7: A shop owner tries to predict the
Q9: Data collected from students in Statistics classes
Q11: A shop owner tries to predict heater
Q28: Teacher: weekly salary,teacher: years of experience<br>A)Teacher: weekly