Essay
Owners of a new appliances store tracked sales (in thousands)for the first 10 days,and displayed the data in a scatterplot.Make a histogram of the daily sales since the shop has been in business. 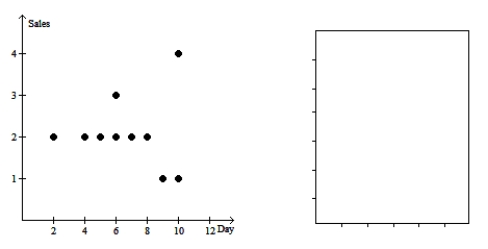
Correct Answer:

Verified
Correct Answer:
Verified
Q1: A science instructor assigns a group of
Q14: Cloudy days,rainy days<br>A)Negative,nonlinear,strong<br>B)Positive,nonlinear,moderate<br>C)Negative,linear,strong<br>D)Positive,nonlinear,strong<br>E)Positive,linear,moderate
Q17: Oranges: circumference (centimetres),oranges: weight (grams)<br>A)Negative,nonlinear,moderate<br>B)Negative,straight,moderate<br>C)Positive,straight,moderate<br>D)Positive,nonlinear,moderate<br>E)Positive,no form,strong
Q19: A study of consumer behavior finds a
Q21: Several scatterplots are given with calculated correlations.
Q25: A scientist collects data to predict the
Q27: A study is conducted on the causes
Q27: Oranges: weight (ounces),oranges: weight (grams)<br>A)Positive,straight,strong<br>B)Positive,nonlinear,moderate<br>C)Negative,straight,moderate<br>D)Negative,nonlinear,moderate<br>E)Positive,no form,strong
Q52: Adult weight (kg):,Adult height (m):<br>A)Adult weight (kg):
Q62: Year,results of race<br>A)Year: both Results of race: