Essay
A university radio station has been airing a public service announcement (PSA)that gives a telephone number students can call to get information on upcoming campus events.In order to determine the optimal number of times per day to run the PSA,the station has been counting the number of calls generated each day as a function of the number of times the PSA was aired.The results of the experiment are summarized in the table below. 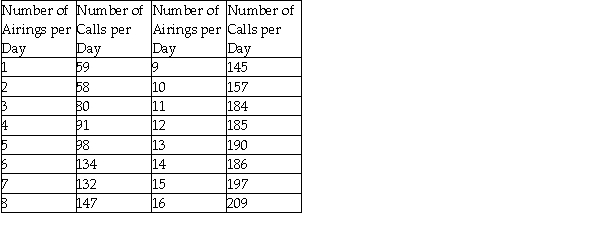
a)Re-express the data by squaring the number of calls per day,then plot the re-expressed data as a scatterplot. 
b)Determine the regression equation and correlation coefficient for the re-expressed data.
c)Interpret the slope of your model.Comment on the meaning and usefulness of this slope.
Correct Answer:

Verified
Correct Answer:
Verified
Q1: For the model <img src="https://d2lvgg3v3hfg70.cloudfront.net/TB3448/.jpg" alt="For the
Q2: Use technology to create a curved model
Q4: A company manufactures of polypropylene rope in
Q5: The relationship between two quantities X and
Q6: One of the important factors determining a
Q7: A forester would like to know how
Q8: For the model <img src="https://d2lvgg3v3hfg70.cloudfront.net/TB3448/.jpg" alt="For the
Q9: For the model <img src="https://d2lvgg3v3hfg70.cloudfront.net/TB3448/.jpg" alt="For the
Q10: Use technology to create a curved model
Q11: For the model <img src="https://d2lvgg3v3hfg70.cloudfront.net/TB3448/.jpg" alt="For the