Multiple Choice
The table shows the careers of a group of retired people and their ages at retirement. 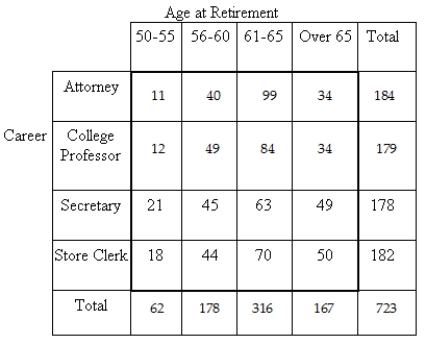
What is the probability that a person who retired between the ages of 56 and 60 was a college professor?
A) 0.274
B) 0.246
C) 0.068
D) 0.248
E) 0.275
Correct Answer:

Verified
Correct Answer:
Verified
Related Questions
Q2: There is a huge pile of buttons
Q11: You are dealt a hand of three
Q22: The table shows the political affiliation of
Q27: In one town in British Columbia,only 27%
Q52: Applicants for a job first submit a
Q59: Melissa is looking for the perfect man.She
Q63: You are dealt a hand of three
Q75: You are dealt a hand of three
Q84: In the small town,a certain type of
Q89: The date is February 29.What is the