Essay
Here are plots of data for Studentized residuals against Length. 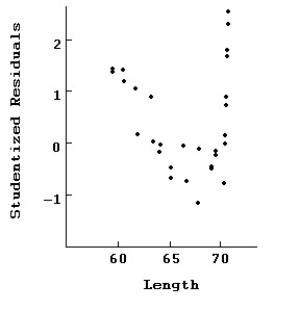
Here is the same regression with all of the points at 70 removed.
Dependent variable is: Weight
30 total bears of which 10 are missing
R-squared = 97.8% R-squared (adjusted)= 97.3%
s = 2.96 with 20 - 4 = 16 degrees of freedom 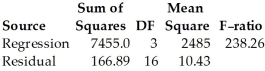
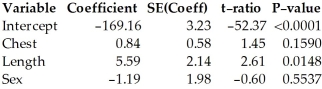
Compare the regression with the previous one.In particular,which model is likely to make the best prediction of weight? Which seems to fit the data better?
Correct Answer:

Verified
Correct Answer:
Verified
Q2: Here are plots for Studentized residuals against
Q3: An actuary wishes to predict the life
Q5: A math professor is trying to determine
Q6: Here are plots of data for Studentized
Q7: The manager of a human resources department
Q8: The manager of a human resources department
Q9: A histogram of the externally Studentized residuals
Q10: A real estate agent wishes to predict
Q10: A company hired 25 employees for various
Q11: The manager of a human resources department