Essay
The table below displays data showing weight gain,in grams,for 12 young rats,three from each of four litters.Three different diets (the treatments)were assigned at random to the three siblings in litter one (block 1).This was repeated for the other three litters (blocks 2,3,and 4). 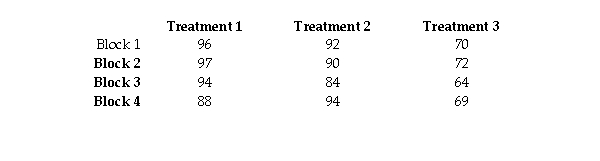
Conduct a Friedman test at the 0.05 level of significance to determine if there are differences between the three diets.
Correct Answer:

Verified
H0: The distributions of weight gain are ...View Answer
Unlock this answer now
Get Access to more Verified Answers free of charge
Correct Answer:
Verified
View Answer
Unlock this answer now
Get Access to more Verified Answers free of charge
Q6: Below are bacteria count for four different
Q7: Consider the following data from an experiment
Q8: The table below shows the weights of
Q9: A person who commutes to work is
Q10: A group of persons filled in a
Q12: A researcher wishes to compare the GPAs
Q13: A researcher was interested in comparing the
Q14: Five students took a math test before
Q15: A teacher uses two different programs to
Q16: A study was conducted to compare the