Multiple Choice
Electrostatic potential maps use color to portray the calculated electron distribution in a molecule.Atoms that are electron poor and carry a δ+ charge are shown in blue.Atoms that are electron rich and carry a δ- charge are shown in red.Atoms with little or no charge are shown in green.The electrostatic potential map of CH3Cl below should show 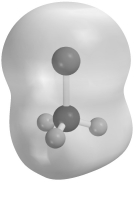
A) C blue and Cl red.
B) C blue and Cl green.
C) C green and Cl blue.
D) C red and Cl blue.
Correct Answer:

Verified
Correct Answer:
Verified
Q174: What is the geometry around the central
Q175: What are the F-Se-F bond angles in
Q176: Which drawing represents a σ<sup>*</sup> antibonding molecular
Q177: What is the geometry around the central
Q178: What is the geometry around the central
Q180: What are the bond angles in the
Q181: Of XeF<sub>2 </sub>and XeF<sub>4,</sub>the one with the
Q182: What is the geometry around the central
Q183: What is the geometry around the central
Q184: What is the hybridization of the carbon