Multiple Choice
The plots below represent vapor pressure vs.temperature curves for diethyl ether,ethanol,mercury,and water,not necessarily in that order. 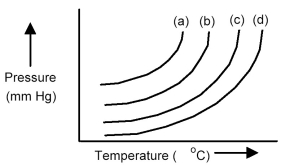
-Based on the relative strengths of the intermolecular forces of attraction of each substance,which is the most likely vapor pressure vs.temperature curve for diethyl ether?
A) curve (a)
B) curve (b)
C) curve (c)
D) curve (d)
Correct Answer:

Verified
Correct Answer:
Verified
Q131: Which of the following statements is not
Q132: The solids formed by Na,Na<sub>2</sub>O<sub>2</sub>,SiO<sub>2</sub>,and N<sub>2</sub> are
Q133: A low-melting crystalline compound that does not
Q134: Which of the following substances has the
Q135: An element forms a body-centered cubic crystalline
Q136: Which of the following phase changes has
Q137: Molecules of a liquid can pass into
Q138: A certain mineral crystallizes in the cubic
Q140: Arrange the following in order of increasing
Q141: For a particular compound,which is expected to