Multiple Choice
The plots below represent vapor pressure vs.temperature curves for diethyl ether,ethanol,mercury,and water,not necessarily in that order. 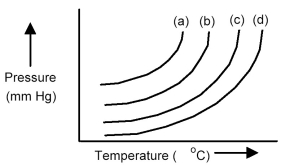
-Based on the relative strengths of the intermolecular forces of attraction of each substance,which is the most likely vapor pressure vs.temperature curve for mercury?
A) curve (a)
B) curve (b)
C) curve (c)
D) curve (d)
Correct Answer:

Verified
Correct Answer:
Verified
Q91: The normal boiling point occurs when the<br>A)intermolecular
Q92: Iridium crystallizes in a face-centered cubic structure.What
Q93: Which of the following is expected to
Q94: When a liquid is heated at its
Q95: An ionic compound crystallizes in a unit
Q97: Of C<sub>2</sub>H<sub>5</sub>OH and C<sub>3</sub>H<sub>5</sub>(OH)<sub>3</sub> the one expected
Q98: Which of the following best explains why
Q99: Identify the packing in the figure shown
Q100: What phases can be present at 200°C
Q101: The normal boiling point of this substance