Multiple Choice
The following diagram shows a close-up view of the vapor pressure curves for a pure solvent and a solution containing a nonvolatile solute dissolved in this solvent. 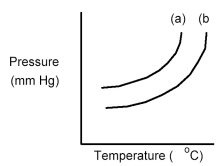
-Which curve is the solvent and what happens to the vapor pressure when the solute is dissolved in the solvent?
A) Curve (a) is the solvent and the vapor pressure decreases.
B) Curve (a) is the solvent and the vapor pressure increases.
C) Curve (b) is the solvent and the vapor pressure decreases.
D) Curve (b) is the solvent and the vapor pressure increases.
Correct Answer:

Verified
Correct Answer:
Verified
Q128: A solution is prepared by dissolving 17.75
Q129: A 2.00 M solution of CaCl<sub>2</sub> in
Q130: What is the molality of ethanol in
Q131: What is the expected freezing point of
Q132: At 25°C the vapor pressures of benzene
Q134: <img src="https://d2lvgg3v3hfg70.cloudfront.net/TB4940/.jpg" alt=" -What is the
Q135: When ethylene glycol,HOCH<sub>2</sub>CH<sub>2</sub>OH,is added to the water
Q136: In a solution that is 75% ethyl
Q137: What molality of pentane is obtained by
Q138: At 80.0°C heptane,C<sub>7</sub>H<sub>16</sub>,has a vapor pressure of