Multiple Choice
A phase diagram of temperature versus composition for a mixture of the two volatile liquids octane (bp =  and decane (bp = 126°C) is shown.
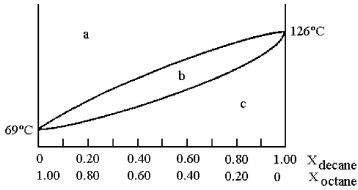
-Assume that you start with a mixture containing 0.80 mol of decane and 0.20 mol of octane,what region of the diagram corresponds to vapor?
A) region a
B) region b
C) region c
D) regions a and c
Correct Answer:

Verified
Correct Answer:
Verified
Q77: Which of the following mixtures have components
Q78: The dose of amoxicillin given to a
Q79: A phase diagram of temperature versus composition
Q80: Sodium hydroxide is available commercially as a
Q81: Concentrations of fluoride in drinking water greater
Q83: A solution of 0.2113 g of water
Q84: Which of the following statements is true
Q85: Which of the following does not affect
Q86: A solution of LiCl in water is
Q87: To make a 0.125 m solution,one could