Multiple Choice
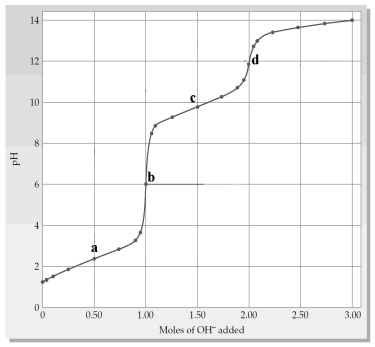
The following plot shows a titration curve for the titration of 1.00 L of 1.00 M diprotic acid H2A with NaOH. 
-Which point a-d represents the H2X/HX- buffer region?
A) point a
B) point b
C) point c
D) point d
Correct Answer:

Verified
Correct Answer:
Verified
Related Questions
Q170: The pH of a 0.150 M formic
Q171: The half equivalence point in the titration
Q172: Which of the following metal hydroxides are
Q173: What is the approximate pH at the
Q174: Which of the following titrations result in
Q176: A solution may contain the following ions
Q177: The following pictures represent solutions that contain
Q178: What is the K<sub>a</sub> of the amino
Q179: The following pictures represent solutions of AgCl,which
Q180: The following pictures represent solutions at various