Multiple Choice
Which of the following graphs illustrates the behavior of a total variable cost? 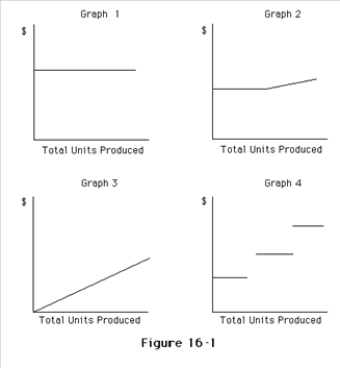
A) Graph 2
B) Graph 3
C) Graph 4
D) Graph 1
Correct Answer:

Verified
Correct Answer:
Verified
Related Questions
Q2: Wiles Inc.'s unit selling price is $40,
Q28: A change in fixed costs as a
Q65: Variable costs are costs that vary in
Q71: Rental charges of $60,000 per year plus
Q104: Refer to the information provided for Kennedy
Q105: If a business had sales of $4,000,000,fixed
Q110: For the current year ending January 31,Ringo
Q121: If direct materials cost per unit decreases,
Q135: The relevant range is useful for analyzing
Q143: If direct materials cost per unit increases,