Multiple Choice
Which of the following graphs illustrates the nature of a mixed cost? 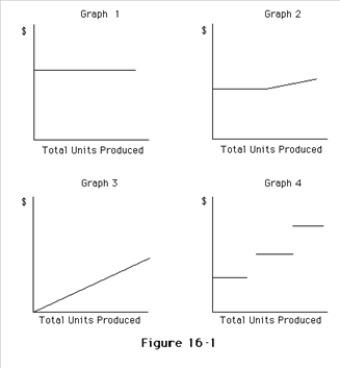
A) Graph 2
B) Graph 3
C) Graph 4
D) Graph 1
Correct Answer:

Verified
Correct Answer:
Verified
Related Questions
Q12: Compute the break-even point (in dollars) if
Q15: The following is a list of various
Q17: Which of the following best describes the
Q18: For the coming year,Belton Company estimates fixed
Q29: The difference between the current sales revenue
Q78: The graph of a variable cost per
Q83: If fixed costs are $300,000 and variable
Q92: Which of the following activity bases would
Q125: The variable cost per unit remains constant
Q187: A production supervisor's salary that does not