Essay
The following cost graphs illustrate various types of cost behaviors. 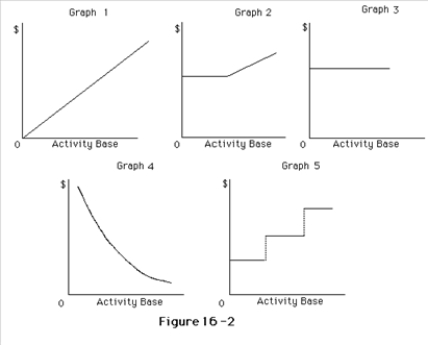
Correct Answer:

Verified
Graph (a)3 (b)3 (c)3 (d)2...View Answer
Unlock this answer now
Get Access to more Verified Answers free of charge
Correct Answer:
Verified
Graph (a)3 (b)3 (c)3 (d)2...
View Answer
Unlock this answer now
Get Access to more Verified Answers free of charge
Related Questions
Q12: Compute the break-even point (in dollars) if
Q27: Tops Company sells Products D and E
Q28: If fixed costs are $790,000 and the
Q29: The difference between the current sales revenue
Q29: Given below are the two independent situations:<br><br>(a) If
Q30: Which of the following describes the behavior
Q78: The graph of a variable cost per
Q84: If fixed costs are $850,000 and the
Q92: Which of the following activity bases would
Q125: The variable cost per unit remains constant