Multiple Choice
The figure shows an energy level diagram for the hydrogen atom. Several transitions are shown and are labeled by letters. 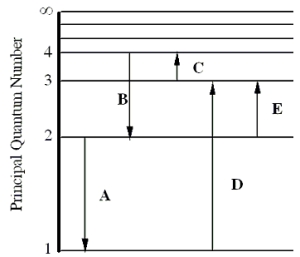 Note: The diagram is not drawn to scale.
-Determine the wavelength of the radiation involved in transition B.
A) 291 nm
B) 364 nm
C) 487 nm
D) 652 nm
E) 1910 nm
Correct Answer:

Verified
Correct Answer:
Verified
Q1: The ground state electronic configuration of a
Q2: Determine the maximum wavelength of incident radiation
Q3: Complete the following statement: An h subshell
Q4: An electron in an atom has the
Q5: Use the Bohr model to estimate
Q7: Complete the following statement: An individual copper
Q8: Complete the following sentence: In the condition
Q9: How many electron states (including spin states)
Q10: Determine the kinetic energy of an electron
Q11: What is the longest wavelength in the