Multiple Choice
Which one of the following graphs illustrates how capacitive reactance varies with frequency? 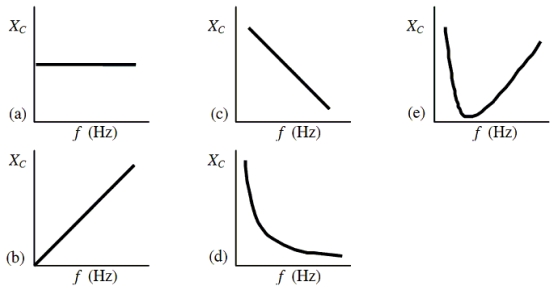
A) a
B) b
C) c
D) d
E) e
Correct Answer:

Verified
Correct Answer:
Verified
Related Questions
Q63: When the frequency of an ac circuit
Q64: A 14.0-µF capacitor and a 1480-
Q65: Complete the following statement: The main difference
Q66: An ac generator supplies a peak
Q67: An ac generator supplies an rms
Q69: The graph shows the voltage across
Q70: A series RCL circuit operating at
Q71: An ac generator supplies a peak
Q72: A 315- <span class="ql-formula" data-value="\varOmega"><span class="katex"><span
Q73: An ac generator supplies an rms