Multiple Choice
Which one of the following graphs shows how the inductive reactance varies with frequency? 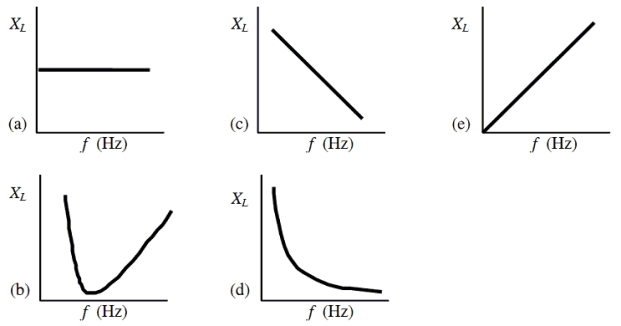
A) a
B) b
C) c
D) d
E) e
Correct Answer:

Verified
Correct Answer:
Verified
Related Questions
Q49: What is the inductance of the inductor
Q50: The following table gives the reactance and
Q51: In an ac circuit, a 0.055-H inductor
Q52: An ac generator is connected across
Q53: Two 250-µF capacitors and a 1.5-mH inductor
Q55: Which one of the following statements concerning
Q56: An ac generator supplies a peak
Q57: An ac generator supplies an rms
Q58: An ac generator supplies an rms
Q59: Two series RCL circuits have the same