Multiple Choice
The graph shows the impedance as a function of frequency for a series RCL circuit. At what frequency will this circuit resonate? 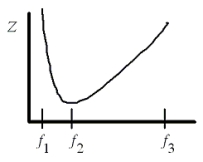
A) f1
B) f2
C) f3
D) f1 or f3
E) f1 or f2 or f3
Correct Answer:

Verified
Correct Answer:
Verified
Related Questions
Q35: The table below shows the values of
Q36: An ac generator supplies a peak
Q37: An ac generator supplies a peak
Q38: The graph shows the voltage across and
Q39: Two 3.25-µF capacitors are connected in series
Q41: Which circuit elements act to oppose changes
Q42: An oscillating LC circuit has a resonant
Q43: The graph shows the impedance as a
Q44: A variable capacitor is connected to an
Q45: Use the information given in the