Multiple Choice
Which one of the following pressure-volume graphs represents an isochoric process? 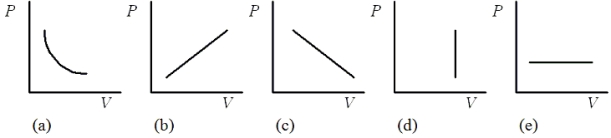
A) (a)
B) (b)
C) (c)
D) (d)
E) (e)
Correct Answer:

Verified
Correct Answer:
Verified
Related Questions
Q9: Complete the following statement: Walls that separate
Q31: A container holding 1.2 kg of water
Q38: An ideal monatomic gas undergoes an adiabatic
Q39: When the gas enclosed beneath the piston
Q41: A paddle wheel frictionally adds thermal energy
Q42: A system containing an ideal gas at
Q45: Determine the quantity of heat added to
Q48: A 1.00-kg sample of steam at 100.0
Q54: Rick spends four hours researching on the
Q66: A heat engine operates between a hot