Multiple Choice
Which one of the following graphs shows the rate at which heat is emitted from a hot body as a function of its Kelvin temperature T? 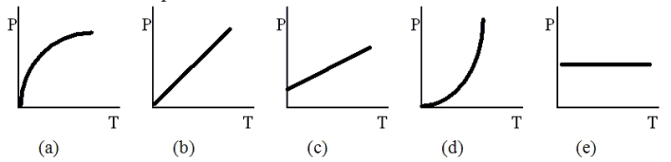
A) (a)
B) (b)
C) (c)
D) (d)
E) (e)
Correct Answer:

Verified
Correct Answer:
Verified
Related Questions
Q7: Which one of the following objects,all initially
Q13: The sun continuously radiates energy into space
Q17: Which one of the following statements concerning
Q30: Assume that the sun is a sphere
Q31: On a cold winter day, the outside
Q34: Heat is conducted by two cylindrical rods,
Q35: Which one of the following statements concerning
Q36: A hot metal ball is hung in
Q37: A slab of insulation is made of
Q40: Two cylindrical steel rods A and B