Multiple Choice
The graph shows the equilibrium vapor pressure versus temperature for a certain liquid and its vapor within an open container. If the container is at sea level, at approximately what temperature will the liquid boil? 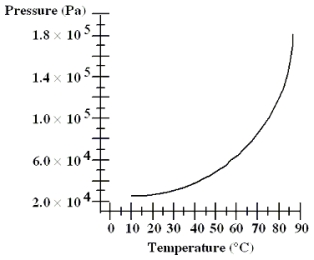
A) 50 °C
B) 65 °C
C) 75 °C
D) 85 °C
E) 100 °C
Correct Answer:

Verified
Correct Answer:
Verified
Related Questions
Q23: A tanker ship is filled with 2.25
Q24: A 0.0500-kg lead bullet of volume 5.00
Q25: Zirconium tungstate is an unusual material
Q26: A 0.30-kg lead ball is heated to
Q27: Complete the following statement: When solid NH<sub>3</sub>
Q29: A thin, circular disc is made of
Q30: An aluminum tank of volume 0.0300 m<sup>3</sup>
Q31: On a warm summer day, the relative
Q32: A liquid is in equilibrium with its
Q33: A gold sphere has a radius of