Multiple Choice
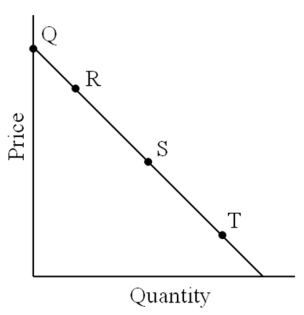
-In the demand curve shown in the above graph we are closest to unit elasticity at point
A) point Q.
B) point R.
C) point S.
D) point T.
Correct Answer:

Verified
Correct Answer:
Verified
Related Questions
Q65: When demand is elastic,<br>A)the percentage change in
Q66: Which is NOT a determinant of the
Q67: Which statement is true?<br>A)A perfectly elastic demand
Q68: <img src="https://d2lvgg3v3hfg70.cloudfront.net/TB5852/.jpg" alt=" -About how much
Q69: Demand is elastic if elasticity is greater
Q71: Which statement is false?<br>A)The most important determinant
Q72: Statement I: A tax increase on a
Q73: Total revenue will rise if<br>A)demand for a
Q74: Which statement is most likely true about
Q75: Statement I: Canada's $3 per pack cigarette