Essay
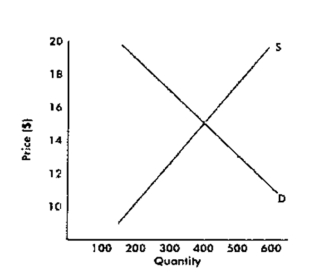
A.Draw another line on the graph representing a tax increase of $1.
B.How much is the new equilibrium price and quantity?
C.How much of the tax is borne by the buyers and how much is borne by the sellers?
Correct Answer:

Verified
(a)  (b) $15.50 and ...
View Answer
Unlock this answer now
Get Access to more Verified Answers free of charge
Correct Answer:
Verified
View Answer
Unlock this answer now
Get Access to more Verified Answers free of charge
Q48: <img src="https://d2lvgg3v3hfg70.cloudfront.net/TB5852/.jpg" alt=" -How much
Q77: If you'd "walk a mile for a
Q97: If more substitutes become available demand tends
Q102: If demand is inelastic and price is
Q114: <img src="https://d2lvgg3v3hfg70.cloudfront.net/TB5852/.jpg" alt=" -About how
Q118: <img src="https://d2lvgg3v3hfg70.cloudfront.net/TB5852/.jpg" alt=" -About how much
Q143: <img src="https://d2lvgg3v3hfg70.cloudfront.net/TB5852/.jpg" alt=" -How much revenue
Q186: If elasticity of demand is 5 and
Q201: In the short run, the demand for
Q202: In general, the fewer the substitutes available